Part 2 Data preprocessing
Tasks - [ ] Download daily close (unadjusted) prices for selected components - [ ] Check for missing values and replace missing values - [ ] Save the extracted data - [ ] Plot the time series
2.1 Setup project and load dependencies
# install.packages('quantmod')
if(!require("indexanalysis", quietly = TRUE)){
   setwd(package_dir);
   devtools::install("indexanalysis")
   library(indexanalysis)
  }else{library(indexanalysis) ; print("loaded")}
library(tidyverse)
library(rlang)
library(roxygen2)
library(magrittr)
library(glue)
library(tsibble)
library(quantmod)
library(zoo)
library(ggplot2)
library(scales)
library(purrr)
library(furrr)
library(lubridate)
library(readr)
The package indexanalysis contains functions that I built to simplify this analysis.
2.2 Download price data from databases
2.2.1 Read stock component parameters
I selected 6 manufacturers: Apple, HP, Lenovo, Dell, Acer, and Asus. I inserted basic metadata on each component in a CSV file available in the raw data folder.
2.2.2 Get daily close prices from remote sources
I picked an arbitrary period of historic data to carry out the analysis.
symbols <- index_parameters$Symbol
start_date = zoo::as.Date("2021-01-01")
end_date = zoo::as.Date("2021-04-01")-1
2.2.2.1 Download data for each component and prepare a tibble
all_price = c("Open", "Close", "High", "Low", "Volume", "Adjusted")
# keep_price = c("Close")
keep_price = all_price
plan(multisession, workers = length(symbols))
# Fetch, filter, and format tables corresponding to each symbol
prices_ts <- symbols %>%
future_map_dfr(~indexanalysis::xts_finance_to_tibble(symbol = .x,
                                    from = start_date,
                                    to = (end_date+1) ))
#> Registered S3 method overwritten by 'quantmod':
#>   method            from
#>   as.zoo.data.frame zoo
#> Registered S3 method overwritten by 'quantmod':
#>   method            from
#>   as.zoo.data.frame zoo
#> Registered S3 method overwritten by 'quantmod':
#>   method            from
#>   as.zoo.data.frame zoo
#> Registered S3 method overwritten by 'quantmod':
#>   method            from
#>   as.zoo.data.frame zoo
#> Registered S3 method overwritten by 'quantmod':
#>   method            from
#>   as.zoo.data.frame zoo
#> Registered S3 method overwritten by 'quantmod':
#>   method            from
#>   as.zoo.data.frame zoo
xts_finance_to_tibble fetch the data and return the time series in a tidy format.
2.2.3 Preprocess data: remove complete NAs and impute LOCF
To be able to compete the index, we need complete data for each selected components (i.e. for each time step in the time series, each component takes a value). The table contains 1 row per component per time step. It does not allow us to see if some time steps (or dates) are missing for a component. We need to add the gaps to the time series and fill them.
checkpoint(prices_ts)
checkpoint(prices_ts, T)

prices_ts %>%
  as_tsibble(index = "Date", key = "Key") %>%
  group_by_key() %>%
  fill_gaps(.full = TRUE, .start = start_date, .end = end_date) %>%
  pivot_longer(cols = all_of(keep_price),
               names_to = "price", values_to = "value") %>%
  mutate(isna = is.na(value)) %>%
  arrange(Date, price) %>%
  unite("Component_Price", all_of(c("Key", "price") ) , sep = " ") %>%
  ggplot(aes(x = Date, y = Component_Price, fill = isna ))+
  geom_raster()+
  scale_fill_manual(name = "",
                    values = c("steelblue", "tomato3"),
                    labels = c("Present", "Missing"))+
  labs(x = "Time",
       y = "Component price")
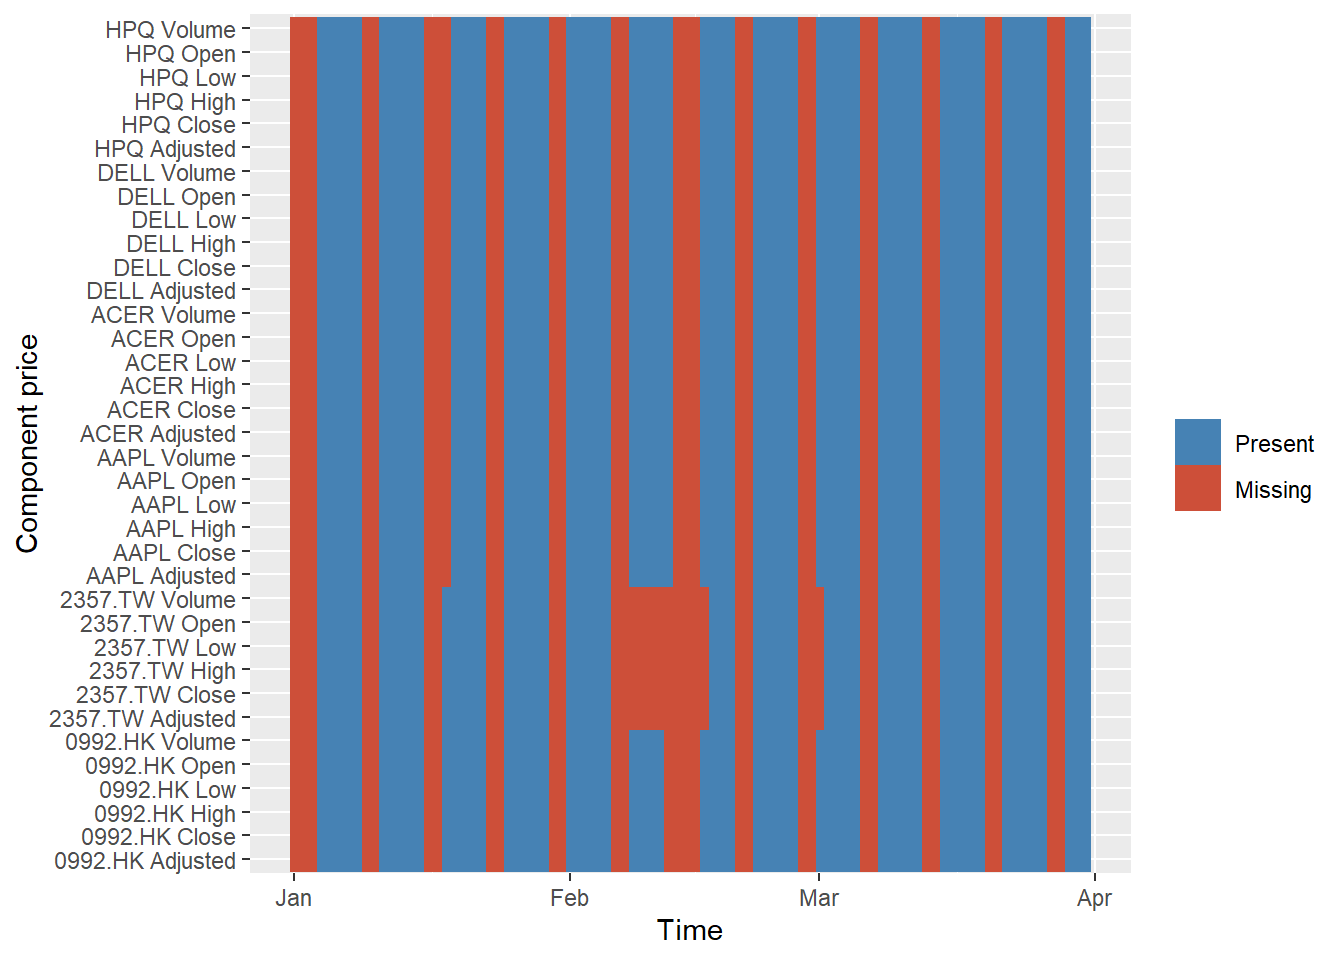
Some dates are periodically missing: most likely, non-business days and holidays.
However, the missing values are not equally distributed across components (e.g., Asus, with symbol 2357.TW, is missing some data in February).
We need to remove those periodic missing values and replace or remove the non-complete cases.
Some dates are periodically missing: most likely, non-business days and holidays.
However, the missing values are not equally distributed across components (e.g., Asus, with symbol 2357.TW, is missing some data in February).
We need to remove those periodic missing values and replace or remove the non-complete cases.I will here filter out: - the dates for which none of the components contain data, - carry forward the last observation (i.e. LOCF) to fill the gaps.
For close and open prices, another way would be to take the previous closing price for the next opening price.
## Calculate how many components contain NAs per date
prices_ts <- prices_ts %>%
  as_tibble%>%
  select(-c(all_price[!(all_price %in% keep_price)] )) %>%
  indexanalysis::pivot_prices_wider(nameS = "Key", keep_price)%>%
  rowwise() %>%
  mutate(NAs = sum(is.na(c_across(!Date)) ) )%>%
  ungroup


# LOCF
prices_ts <- prices_ts %>%
  # if n components x 6 prices contains NA, then no data for that day: skip the day
  filter(NAs < length(symbols) * length(keep_price) ) %>%
  arrange(Date) %>%
  # For other days, LOCF
  tidyr::fill(contains(keep_price), .direction = "down") %>%
  select(-NAs)


# Pivot longer
prices_ts <- prices_ts %>%
  indexanalysis::pivot_prices_longer(symbols = symbols, separate = T)%>%
  as_tsibble(., index = Date, key = c("Symbol", "Price.Type" ))
2.2.4 Save as .csv
prices_ts_close <- prices_ts %>%
  as_tibble%>%
  filter(Price.Type == "Close")%>%
  indexanalysis::pivot_prices_wider(nameS = c("Symbol", "Price.Type"), valueS = "Price")


readr::write_csv(prices_ts_close,
          file = file.path(clean_data_dir, project_dir, "prices_ts.csv" ) )

readr::write_csv(prices_ts,
          file = file.path(clean_data_dir, project_dir, "prices_ts_all.csv" ) )